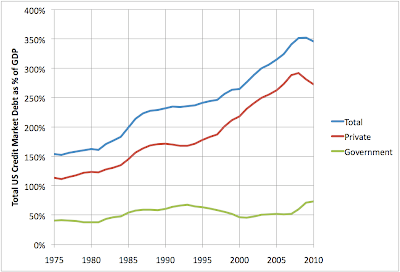
The other day, I posted this graph of the various components of US debt:

Obviously, deleveraging in the household and financial sector has begun. The question is, how long will it go on, and how low must the various debt-to-gdp ratios go? In this post, I look at various ways of guesstimating this.
One approach is to assume that the level at some point in the past was "normal" and figure roughly how long it will take to get back to that at the current rate of deleveraging. Eg, maybe the household debt to GDP ratio of 60% in 1990 was ok. Since in the last three years we are doing about 1.3% per year of household deleveraging (percentage points of GDP), it will take about 25 years to get there. Clearly this is extremely imprecise - if you thought we only had to get back to 2000 levels, it would take less time - a little over 15 years - whereas if you thought you had to get back to 1975 levels, it would take even longer. And we don't have any basis for picking what is an appropriate level that the economy is going to decide it needs to get back to. Also, the pace of deleveraging might change in the future.
Another approach is to look at other historical deleveraging episodes. The most famous is of course the Great Depression, where we have this graph (from John Mauldin) of total US credit market debt to GDP:
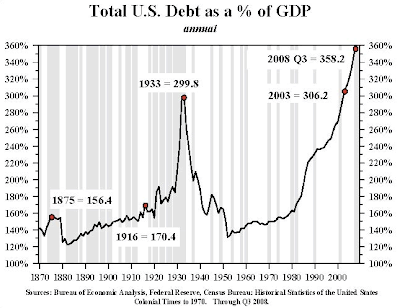
You can see that the main deleveraging episode went from 1929 to 1942 (13 years), and total debt fell from 300% of GDP to about 160%. So deleveraging was happening at about 10% of GDP/year. Presumably, that was too fast, since output fell massively, unemployment went through the roof, and misery spread all over.
If you compare the current episode to date, on the same basis of total credit market debt, it looks like this:

(There's a small discrepancy between the absolute level of Mauldin's figures and mine - computed from the Federal Reserve Flow of Funds data and BEA GDP - that I don't know the reason for. Could be due to revisions in the series).
On a total credit market basis, we are deleveraging at only a few percent per year, with increases in government debt partially offsetting the private sector deleveraging. Arguably, it's much too soon to tell how fast it's really going to go, however.
Another case of interest, is Japan post 1990, where I found this graph (at this interesting post):
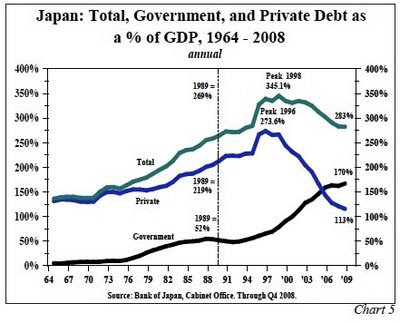
On a total basis, Japan has so far deleveraged from 345% of GDP in 1998 to 283% at the end of 2008. The process is presumably not over, and the rate is about 6%/year. So slower than the US in the great depression. And Japan has had stagnant growth, but some growth (of course, Japan was running a trade surplus the entire time, which is not likely to be the US condition). The private sector in Japan was deleveraging at about 13%/year, but half of this was offset by a dramatic expansion of the government's liabilities. Japanese private debt is now less than half of what it was at the peak.
A similar picture for recent decades in the US would look like this:
So the US entered the crisis with similar ratios to Japan.
An important difference, however, is this time it's global. This interesting McKinsey report shows debt to GDP for a number of important economies:

So all the advanced economies need to deleverage at the same time...
Finally, yesterday morning, long time reader and friend Southsider1 stopped by my blogging cafe for breakfast, and we hashed out another method of guesstimating how long deleveraging needs to run. The idea is this: deleveraging will be required, and the economy will not be normal, until there are no more than a few percent of US households in negative equity. In a normal healthy housing market, people are required to put down 10-20% on their house, and house prices are flat or rising in nominal terms, so few households have negative equity. Mortgage debt is the bulk of household debt. Also, as long as households are deleveraging, the asset side of bank's balance sheets will be shrinking, and so they will need to shrink their liabilities also. (And to the extent the government requires them to maintain higher capital ratios, this will be so a-fortiori). Thus financial sector deleveraging and household sector deleveraging will be coupled.
I found this research report from CoreLogic which estimates when negative equity will be eliminated in a sample of US geographical areas (you have to give them your contact info to get the report). Their core scenario makes the following assumptions over coming decades: 1) inflation is about 2% annually, 2) real house prices rise by 1% annually, and 3) the main mechanism of eliminating negative equity is people paying off their mortgages while house prices slowly rise.
I have a number of problems with this: right now, core inflation is below 2% and dropping, I think it's implausible that houses will appreciate in real terms over the coming decade, and I think a lot of negative equity situations will be resolved by foreclosure, short-sale, etc, which they appear not to be modeling. That said, the core scenario produces this:
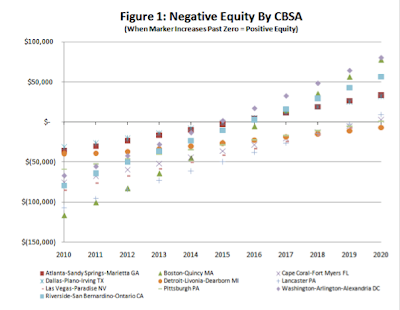
Ie the negative equity is mostly gone after about ten years.
They also briefly mention an alternative scenario with a 1.5% nominal appreciation in house prices which would make it 2017 rather than 2015 when the first markets elimate their negative equity. Presumably, then, the overall process would spin out to about 2025.
All of these methods have problems, and you can pick your poison. What they all have in common though is this: deleveraging will take at least a decade, and it could easily take 15-20 years. In the meantime, the economy is likely to be pretty choppy at best.
Eroding a mountain range of debtEuropean debt worries world
No comments:
Post a Comment