This is a guest post by Kevin Rietmann, known as KLR on The Oil Drum.

A collapse in demand for petroleum products happened in the late 1970s and early 1980s. JD, proprietor of the blog Peak Oil Debunked, examined this briefly in this 2007 post about what he termed ”The Big Glitch”:
So what really does happen when global oil production drops by 15%? Well, it turns out we know the answer to that one because it actually happened once before, in the early 1980's. Production hit a high of 66mbd in 1979, and over the course of 4 years dropped by 14% to 56.6mbd in 1983. In fact, oil production didn't surpass the 1979 high until 1993, 14 years later.
So what did the world look like in 1983, after oil production had collapsed by 15%? I'll tell you what. Go out to your local freeway, and look at it during rush hour, when it's totally crammed with cars. That's exactly what 1983 looked like. I was gassing up as usual, totally oblivious. The "crisis" had such a minor impact on daily life, that I didn't even realize anything out of the ordinary was happening, let alone a liquid fuels armageddon that was wholly shattering the oil dependent economy and reducing the citizenry to poverty. I could be wrong about this, but I'm pretty sure that no one was forced by starvation to eat their Flock of Seagulls albums.
As it happens, demand for petroleum has gone down in the wake of JD's rant; how does it compare to the shortfall of 3 decades ago? This post will examine what happened in the late 70s to demand for the various petroleum products, and compare their rate of downturn to what has transpired since their corresponding recent peaks. This will be about US demand, using EIA data, as it is by far the most comprehensive to be had. The general situation in other regions of the world will be covered briefly at the end.
CERA's Current View of Peak DemandTo move from bloggers to think tanks, CERA made their first pronouncement about US peak demand on June 19, 2008, claiming that a long-term shift in consumer behavior, spurred on by increased penetration of the market by higher efficiency vehicles and higher volumes of biofuels displacing petroleum products, would mean 2007 would be the all time high for US gasoline demand. As it happens, 2008 and 2009 average volumes of gasoline supplied were at 96.80% and 96.75% of the 2007 value, so this initial forecast isn't exactly playing out. A year after CERA issued their report their Managing Director Jim Burkhard stated at a presentation that "Peak Oil is Here," referring of course to their notion of peak demand, not a peak in supply. In response Dave Cohen served up his trademark brand of caustic derision in Peak oil = peak demand?
CERA must have been thinking really hard in the first half of 2008 about how to spin the fact that global demand was growing but supply could barely rise to meet it. And then it must have come to them like a bolt from the blue—peak demand! This is an ingenious solution. The oil supply doesn’t have to grow anymore because we don’t need it to. World oil production capacity doesn’t matter anyway. We can acknowledge peak oil without acknowledging peak oil.
And so in June, 2008 when things looked bleak for the oil supply, CERA issued its report, "Drivers Turn the Corner in the United States". CERA knew, as many of us did, that demand would surely collapse with prices over $140/barrel and stay down for a long, long time.
As Dave subsequently points out, that hasn't exactly transpired, is far from accounting for the world as a whole, and also looks like a lame way of covering for a peak in supply. Others have commented on this topic; Sam Foucher posted a detailed article here in the fall on peak demand in the OECD; and in the last month a pair of additional excellent critiques of peak demand have been published by Kurt Cobb and Chris Nelder. Chris references a Deutsche Bank paper from last fall which is worth reading as well; I will comment briefly on one of its cornerstone assumptions later in this post.
While CERA aren't specifically citing historical examples of demand troughs as JD did - although they are more than happy to bring up failed historic peak oil forecasts, as well as deigning to mention failed past attempts at bringing unconventional oil to market in their uberbullish supply projections - this article will cover the major demand contraction of the late 70s/early 80s, which, as JD points out, restrained production for about 13 years worldwide, and compare them to how things are currently unfolding.
Overview of Demand Destruction in 70s/early 80sTo give a general overview of how the previous phase of demand destruction unfolded, here is a pertinent excerpt from pgs 717-718 of CERA chairman Daniel Yergin's Pulitzer Prize winning history of the oil industry, "The Prize":
Significant changes were also taking place in demand. The massive twentieth-century march toward higher and higher dependence on oil within the total energy mix was reversed by higher prices, security considerations, and government policies. Coal staged a massive comeback in electricity generation and industry. Nuclear power also made a rapid entry into electricity generation. In Japan, liquefied natural gas increased its share in the energy economy and in electricity generation. All this meant, around the world, that oil was being ejected from some of its most important markets and was rapidly losing ground. Its share of the market for total energy in the industrial countries declined from 53 percent in 1978 to 43 percent by 1985.
Not only was petroleum experiencing a declining share of the energy pie, but the pie itself was shrinking, reflecting the profound impact of increased energy efficiency, otherwise known as conservation. Though often dismissed or even ridiculed, conservation had turned out to have massive impact. Energy conservation in modern industrial society meant, for the most part, not deprivation, not "small is beautiful," but greater efficiency and technological innovation. The 1975 legislation that mandated a doubling of the average fuel efficiency of new automobile fleets to 27.5 miles per gallon by 1985 would reduce United States oil consumption by 2 million barrels per day from what it would otherwise have been—just about equivalent to the 2 million barrels per day of additional oil production provided by Alaska. Altogether, by 1985, the United States was 25 percent more energy efficient and 32 percent more oil efficient than it had been in 1973. If the United States had stayed at the 1973 levels of efficiency, it would have used the equivalent of 13 million barrels of oil more than it actually did in 1985. The savings were huge. Other countries made their own dramatic savings. Japan over the same period became 31 percent more energy efficient and 51 percent more oil efficient.
By 1983, the first year of economic recovery, the impact of conservation and fuel switching was clear. Oil consumption in the noncommunist world was 45.7 million barrels per day, about 6 million barrels less than the 51.6-million barrel-per-day level of 1979, which had been the high point. So, while demand had fallen 6 million barrels per day between 1979 and 1983, non-OPEC production had increased by 4 million barrels per day. On top of that, the oil companies eagerly sought to dispose of the tremendous inventories they had built up in anticipation of a demand level that never materialized. Those three trends—the collapse in demand, the relentless buildup of non- OPEC supply, and the Great Inventory Dump—reduced the call on OPEC by something like 13 million barrels per day, a fall of 43 percent from the levels of 1979! The Iranian Revolution and then the Iran-Iraq War had crippled the exporting capacity of those two countries. Yet suddenly, instead of the feared shortage, there was a large surplus of production capacity over market demand in short, the makings of a massive glut.
Recent Drop in Demand vs Drop in Demand in 1970sThis article will examine that collapse in demand. These peaks happened at different times; a problem with building a complete data series is that monthly numbers for the 70s aren't included for many minor products such as ethane-ethylene or petroleum coke, with data only going back to January 1981, a few years after the local peak had arrived. Another shortcoming in the EIA data is that the "Finished Petroleum Products Supplied" series also only begins in January 1981; luckily a monthly series for "Crude Oil and Petroleum Products" does go back to 1973, when the data also begins for products such as Liquified Petroleum Gases and Propane and Propylene. By summing the product series which are included I've derived numbers for monthly Finished Products sans crude oil, which look to be accurate enough; when the series begins the difference between the last summed value and the first EIA number is 93 kb/d, a wholly negligible difference, so I feel confident in using the summed values here. I should explain that Crude Oil itself was a product supplied, presumably for power generation or industrial applications. It peaked at 66 kb/d in 1983, and had hit 0 kb/d in 1999, where it has stayed ever since.
Here are the local peaks for 1973-1979, all values in kb/d:
Crude Oil and Finished Finished Distillate Liquified Petroleum ProductsPetroleum ProductsMotor GasolineFuel OilPetroleum GasesFeb-1979Feb-1979Jun-1978Jan-1977Jan-19792128719794791351032086 Kerosene-Type Propane Residual Jet Fueland PropyleneFuel OilFeb-1979Jan-1977Feb-197895113543974The actual peak for Propane/Propylene was Jan 1973, at 1376 kb/d; to this day Propane/Propylene is a very seasonal product, with winter numbers exceeding those of summer by some 40%, so I have taken the liberty of using the above figure from Jan 1979, which is only 22 kb/d short of the 1973 number.
By calculating percentage values of these product streams from their local peak value we can see how much demand had contracted over the years. I've built up monthly series for 6 years after each 70s local peak, which can be matched with the local peaks from the last 6 years. In most cases these are the absolute peak for the past decade, with a couple of exceptions.
The recent peaks in 2004-2009 for these products were as follows:
Crude Oil and Finished Finished Distillate Liquified Petroleum ProductsPetroleum ProductsMotor GasolineFuel OilPetroleum GasesAug-2005Aug-2005Jul-2007Feb-2007Jan-20042166619473964045822596 Kerosene-Type Propane Residual Jet Fueland PropyleneFuel OilDec-2005Feb-2007Aug-2005175617981051Some of the absolute peaks for the past decade were previous to these dates, so after this section I will conduct the same analysis using annual figures. But first, here are what the December 2009 product supplied numbers would have been, if the decline had followed the same pattern as obtained in the late 70s/early 80s, along with the difference between actual values and what they would have been following the percentage pattern which obtained in the late 70s:
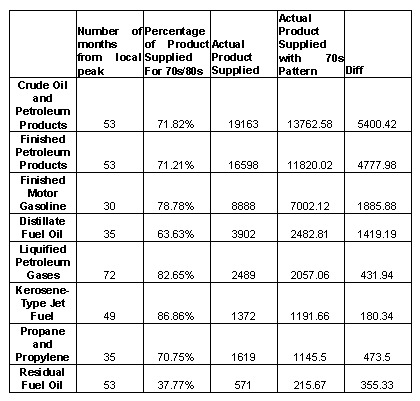
To clarify, here is an example: Dec 09 is 53 months from the modern Aug 05 peak for Crude Oil and Petroleum Products; the equivalent local peak happened in the 70s in Feb 79, and 53 months later was at 71.82% of that peak value. The "Actual Product Supplied" is what was actually brought to market in Dec 09; the next column is what it would have been at 71.82% of that Aug 05 value.
Clearly the current contraction in demand is far less steep than what obtained previously; note that the majority of the peaks in each instance occurred on the cusp of severe economic downturns, beginning in the US in December of 1980 and 2007 respectively. The current recession is by almost all measures proving to be more severe than that of 1980-83, but is having less effect on petroleum demand. To be sure demand destruction has occurred, but if CERA's projections are going to come to pass the rate of contraction will have to show a sizable uptick soon.
Here are tables contrasting the two local eras of peaking, this time on an annual basis:
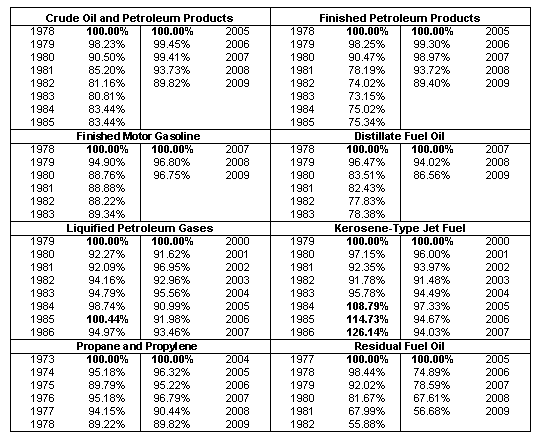
Starting with the peak values from each era and subtracting the current percentages from the 70s numbers, we get:
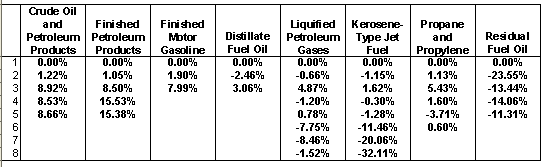
To clarify once more: positive numbers indicate steeper declines in the past, negative numbers mean the current values are steeper. The averages for these numbers are:
CO&PPFPPFMGDFOLPGKTJFP/P RFO6.83%10.11%4.95%0.30%2.11%-0.28%1.11%-15.59%As can be seen resid is contracting faster now than it did previously, but not to the same volumetric effect:
Note as well that LPG and jet fuel quickly exceeded their local peaks; the number of years for each product to exceed its 70s peak were as follows:
CO&PPFPPFMGDFOLPGKTJFP/P RFO21n/a1620878 n/aBut this is misleading to an extent; many streams were back up to ca. 95% within shorter spans of time. Gasoline, for instance, bottomed out at 88.22% in 1982, rising to 98.97% in 1988, before declining again for a few years.
Years to hit bottom:
CO&PPFPPFMGDFOLPGKTJFP/P RFO7766643 n/aThose who wish to examine this in further detail may download my "Product Supplied - Annual" spreadsheet linked at the end of this essay.
CERA's call of course is for demand to never exceed 2007, not for it to decline at comparable rates to historic precedents. But can demand be said to have permanently peaked now? After all, the more sharp declines from the 70s hit bottom fairly quickly; Crude Oil and Petroleum Products only declined for 5 years before beginning its subsequent rise. And for any domestic declines to have meaningful significance in the first place they must be balanced against fast rising demand from developing nations.
The current demand destruction is much milder than those of the past. Are we wrong to assume the pace of decline won't pick up? As Yergin points out, an inflexible attitude about strong future demand took many by surprise 30 years ago, with investors placing faith in bullish forecasts which failed to pan out in spectacular fashion.
What are the qualitative differences between then and now? Do low hanging fruit remain to be picked? I will delve deeper into two examples: finished motor gasoline and residual fuel oil.
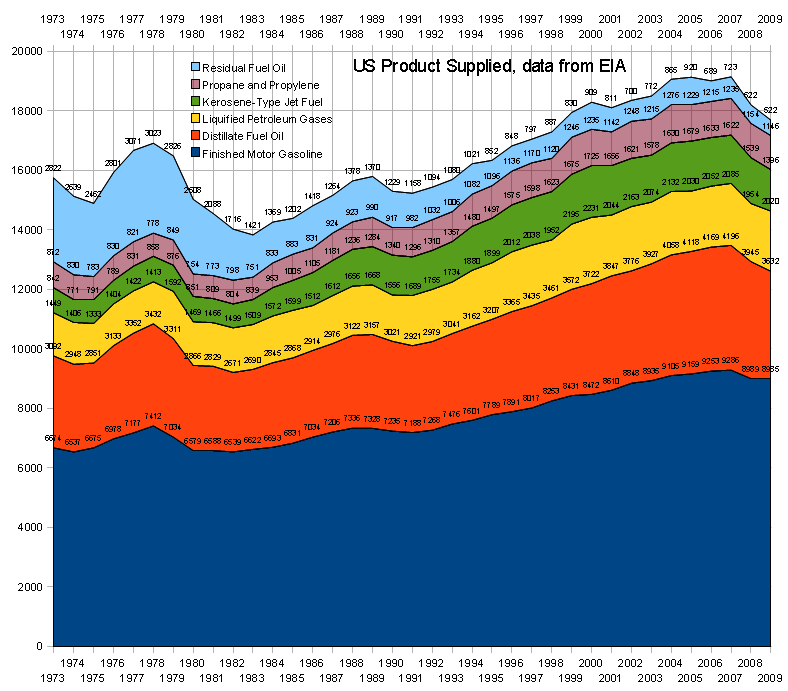
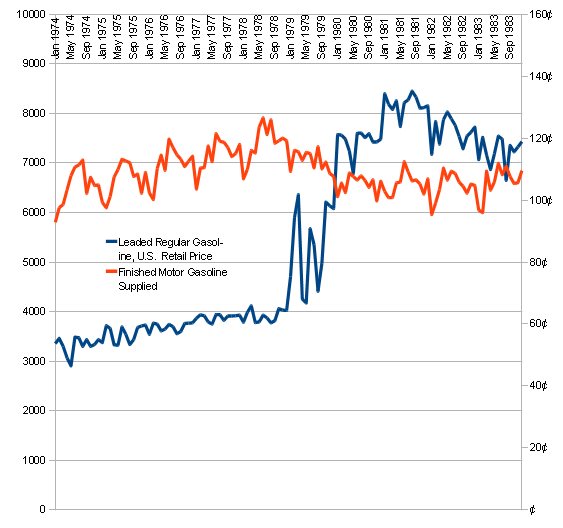
Finished Motor Gasoline - Potential for ImprovementGasoline is the sector of the petroleum industry with which we are all familiar; why did demand for it fall so sharply in 1978-1980? The price spike in the wake of revolution in Iran shutting down its petroleum industry had an obvious effect, as can be seen in this graph:
CAFE standards were meanwhile bringing vehicles to market with much higher fuel economy standards; past figures are followed by tentative present goals set by the White House/EPA:
Model Passenger PercentYear car MPG Improvement197818.005.26%197919.005.00%198020.009.09%198122.008.33%198224.007.69%198326.003.70% 201130.208.94%201231.965.51%201333.725.22%201435.484.96%201537.244.73%201639.004.51%This would firm up the CERA scenario of efficiency curbing demand, if these goals were actually met; however, Dave Cohen explained in his article Obama Tackles the Liquid Fuels Problem that whether this will happen is actually a surprisingly open question.
In addition we are going through the worst downturn in vehicle purchases in history; while 1980 sales were down -18.6%, subsequent years showed milder contractions followed by vigorous rebounds, with an -8.67% average for years of decline; 2006-2009 is -11.09% average:
Total car/ YOY Total Vehicle Sales as %LDV salesSalesRegistrationsof fleet197815,122,000 3.4%142,049,00010.65%197913,984,000-7.5%145,451,0009.61%198011,389,000-18.6%149,477,0007.62%198110,678,000-6.2%152,026,0007.02%198210,426,000-2.4%153,494,0006.79%198312,132,00014.1%157,658,0007.70%198414,187,00014.5%160,264,0008.85%200316,548,000-1.6%222,857,0007.43%200416,906,000 2.1%228,276,0007.41%200517,001,000 0.6%231,905,0007.33%200616,505,000-2.9%234,525,0007.04%200716,089,000-2.5%237,403,0006.78%200813,260,747-17.6%246,000,0005.39%200910,429,553-21.4%250,000,0004.17%While January auto sales were up 2.6%, suggesting 2010 sales will rebound to some extent, it is questionable that they will improve to any great degree. Toyota's stuck accelerator woes have impacted sales of hybrids as well, undercutting another of CERA's precepts, as Prii account for no less than 48.12% of US hybrid sales. In the 70s the size of the vehicle fleet was smaller in the first place as well, allowing new vehicles with greater MPG to have a proportionately larger effect on fleet fuel economy, as can be seen in the above chart.
Counting on hybrids to negate demand for gasoline in the short term is on shaky ground in the first place, since, while their total sales volume has climbed up to a whopping 2.71% of yearly totals, as a percentage of the total US fleet all hybrid sales from 2005-2009 amount to .6568% of the total, a rather insignificant amount; if these had been pure EVs by 2009 they would have negated about 60 kb/d of demand, to give an idea of what an upper bound for their savings would be. Not all of the fleet is in daily use, of course; a general number I use for calcs is the percentage of the US labor force which drives to work solo, that is, 76.1% of ca. 154 million workers = ca. 117 million vehicles, assuming there is a 1:1 correspondence between workers and vehicles, which of course isn't the case; this is a subject of ongoing research for me. But with this lower bound figure (useful for estimating how long it will take to replace the essential part of the vehicle fleet) as a static number cumulative 2005-2009 hybrid sales still only account for 1.38% of the total fleet.
The Deutsch Bank study somehow proposes that total US hybrid sales for 2010 will be 4.2% of "light vehicles," that is, "cars, personal light trucks, commercial light trucks, hybrids, plug-in hybrids and pure electric vehicles." My sources for sales are the Hybrid Dashboard (the Toyota article linked above) and the Hybrid Car Review, both of which do capital work in compiling sales figures.
I haven't fully explored the inroad of hybrid commercial vehicles here; PHEVs aren't on the US market yet, or much of anywhere else for that matter; the lone example marketed in Happy Motoring China has proven to be an utter flop; BYD, the company that builds that PHEV and who plan to be the world's #1 automaker by 2020, have delayed selling it outside of China from 2010 to 2011, and only ca. 10k Volts are slated to be in showrooms at the end of the year; thus the DB forecast for 2010 is quite the question mark, barring total sales contracting sharply enough for it to come about, which I assume isn't what they're talking about.
DB consider PHEVs to be a "game changer," comparable in their effect on petroleum demand to how kerosene shouldered aside whale oil in the 19th century. As the evidence above suggests, the net effect to date is very minor. This isn't US-centric on my behalf either, the US and Japan respectively account for 47.53% and 44.68% of global hybrid sales.
CERA also consider biofuels to be a major factor in future demand destruction; those interested in this should seek out Robert Rapier's articles, both here and on his R-Squared Energy Blog.
Savings in Residual Fuel Oil for Power Generation and Heating in the 1970sThe other sector I will focus on is residual fuel oil, used for "the production of electric power, space heating, vessel bunkering, and various industrial purposes." Note that it accounted for 16.65% of total US demand in 1977, declining over the decades to 3.13% in 2009. As can be seen in this chart of post-peak YOY differences in amount supplied, the cumulative short term savings from phasing out residual fuel oil amounted to around twice that from either gasoline or distillates:
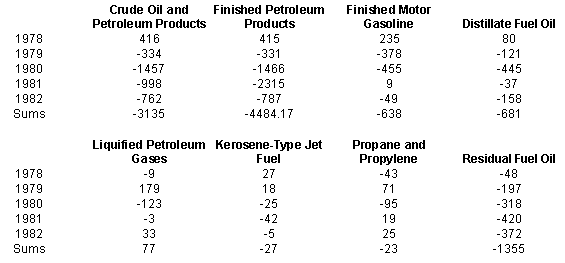
Much of these savings came from declining use of resid for electrical generation; the EIA's Annual Energy Review includes data on use of petroleum in the electric power sector from 1949-2008; in 1977 this amounted to 1,575 kb/d, 51.3% of 3071 kb/d total; for 1982 it was 642 kb/d, 37.4% of a total 1716 kb/d. The sum of YOY Diffs for resid 1973-2009 amounts to -2300.5 kb/d, almost completely obviating the 2310.58 kb/d accounted for by gasoline.
Potential for Savings in Petroleum for Power Generation and Heating NowOther nations are strongly dependent on petroleum for power generation; JD also had a post on this topic in March 2008. In North America resid was displaced primarily by natural gas; in Europe nuclear and hydro served the same function. Various regions have changed their mix of petroleum consumption over the years; as a preliminary example, here is BP data on OECD demand, broken down into 4 general sectors:
OECD (1978)OECD (2008)Light distillates31.89%36.25%Middle distillates29.36%36.13%Fuel oil23.47%7.43%Others15.28%20.19%Other examples may be seen in the BP Stat Review. My worksheet version has more percentage figures like the above (link at bottom). JD's preliminary figure for 2004 use of petroleum in power generation worldwide was 3.58 mb/d; using a newer edition of the same data source (the World Bank's World Development Indicators (WDI)) I get 3.82 mb/d for 2006, a slight increase. Both of our figures were for 620 kwH/bbl or 35% efficiency, which I've subsequently discovered is likely to be a bit on the high end, given what this 2000 EIA paper suggests:
The national average thermal efficiency of power generation from fossil fuels in 1999 was estimated to be 32.54 percent, slightly higher than the previous year's average of 32.42 percent.
This refers to the US. Perhaps efficiency improved 2% in the interim; JD gives no source for his figure. Numbers like the EIA's are common in other articles I've come across, as well as being in use by knowledgeable commentators such as Engineer-Poet.
JD also includes this very intriguing bit of information from veteran oil industry analyst Henry Groppe:
[Henry Groppe] believes that something like 20mbpd of the current 84mbpd of oil demand is going for heat and power generation primarily in developing countries. He thinks that with oil in the $50-$60 range, all of this will get converted to coal or natural gas, and that, along with vehicle fuel efficiency, will be the main initial responses to peaking, and will keep us out of serious economic pain for a decade or so.
This is from Stuart Staniford, relating what various speakers had to say at the 2005 ASPO-USA Denver Conference. Whether he subsequently examined this in depth I'm not sure; my intuition is that efficiencies in developing countries are often likely much lower than the EIA figure for the US, as Groppe's comment might suggest; either that, or a sizable amount of demand worldwide is for domestic heating. What is more, these same countries which are heavily dependent on oil for power are often major producers of that oil in the first place. According to the WDI data no less than 19082 kb/d of production is coming from oil producing nations who also are >50% dependent on oil for their power generation. Here are some preliminary numbers (using the 35% efficiency figure), all values in kb/d:
2006 cons for elec 2006 TotalgenerationConsumption% of Total Iraq138.85532.9926.05%Kuwait152.50266.8757.14%Iran152.771,693.049.02%Indonesia171.151,172.9114.59%Italy202.601,812.5911.18%China227.827,381.773.09%Mexico238.241,969.9512.09%United States358.8720,687.421.73%Japan409.605,213.117.86%Saudi Arabia415.531,841.4422.57%The choice of countries here is dictated simply by their being those which used the highest volumes of oil for power generation in 2006. As Groppe suggests these numbers could in many instances be much higher, especially in countries with antiquated/dilapidated infrastructure such as Iran or Iraq. If 23.8% of world demand is accounted for by power and heat, a staggering amount of low hanging fruit is waiting to be plucked, and the substitutes in many important cases needn't necessarily be other fossil fuels or nuclear; as has been observed, Saudi Arabia is the Saudi Arabia Of Solar Energy, and they are making preliminary noises about going renewable, with possible assistance from EU members, too. This could potentially be a major growth sector for renewable companies, freeing up oil exports in the process; whether the OECD example of shifting away from petroleum for power generation can be ported successfully to developing nations will be the subject of a future article, along with a closer examination of how global petroleum demand has changed.
What May Be AheadIn conclusion to this article, here is the following paragraph from Stuart's 2005 piece excerpted above:
I need to research it, but that story made a lot of sense to me. Fuel switching in heat and power was exactly what the US and Europe did back in the late 70s and early eighties, so it's believable that developing countries would do that this time around. Combine that with a lot of OECD fuel efficiency improvements (which have already begun) and we can probably maintain economic growth through quite a bit of the early post-peak era (except for geo-political shocks). That also buys us more time to start doing the harder things that will need to be done down the road.
Staniford Oil Drum articles on the US vehicle fleet:
The Auto Efficiency Wedge
Why We Drive
Some very messy spreadsheets of mine, Open Office format:
Electricity (from World Development Indicators 2009)
Statistical Review of World Energy 2009 Work Copy
Hybrid Vehicle Sales
Product Supplied - Annual
Product Supplied - Monthly
Local publishers rush to fill digital demandIt’s time to deal with Peak Oil
No comments:
Post a Comment